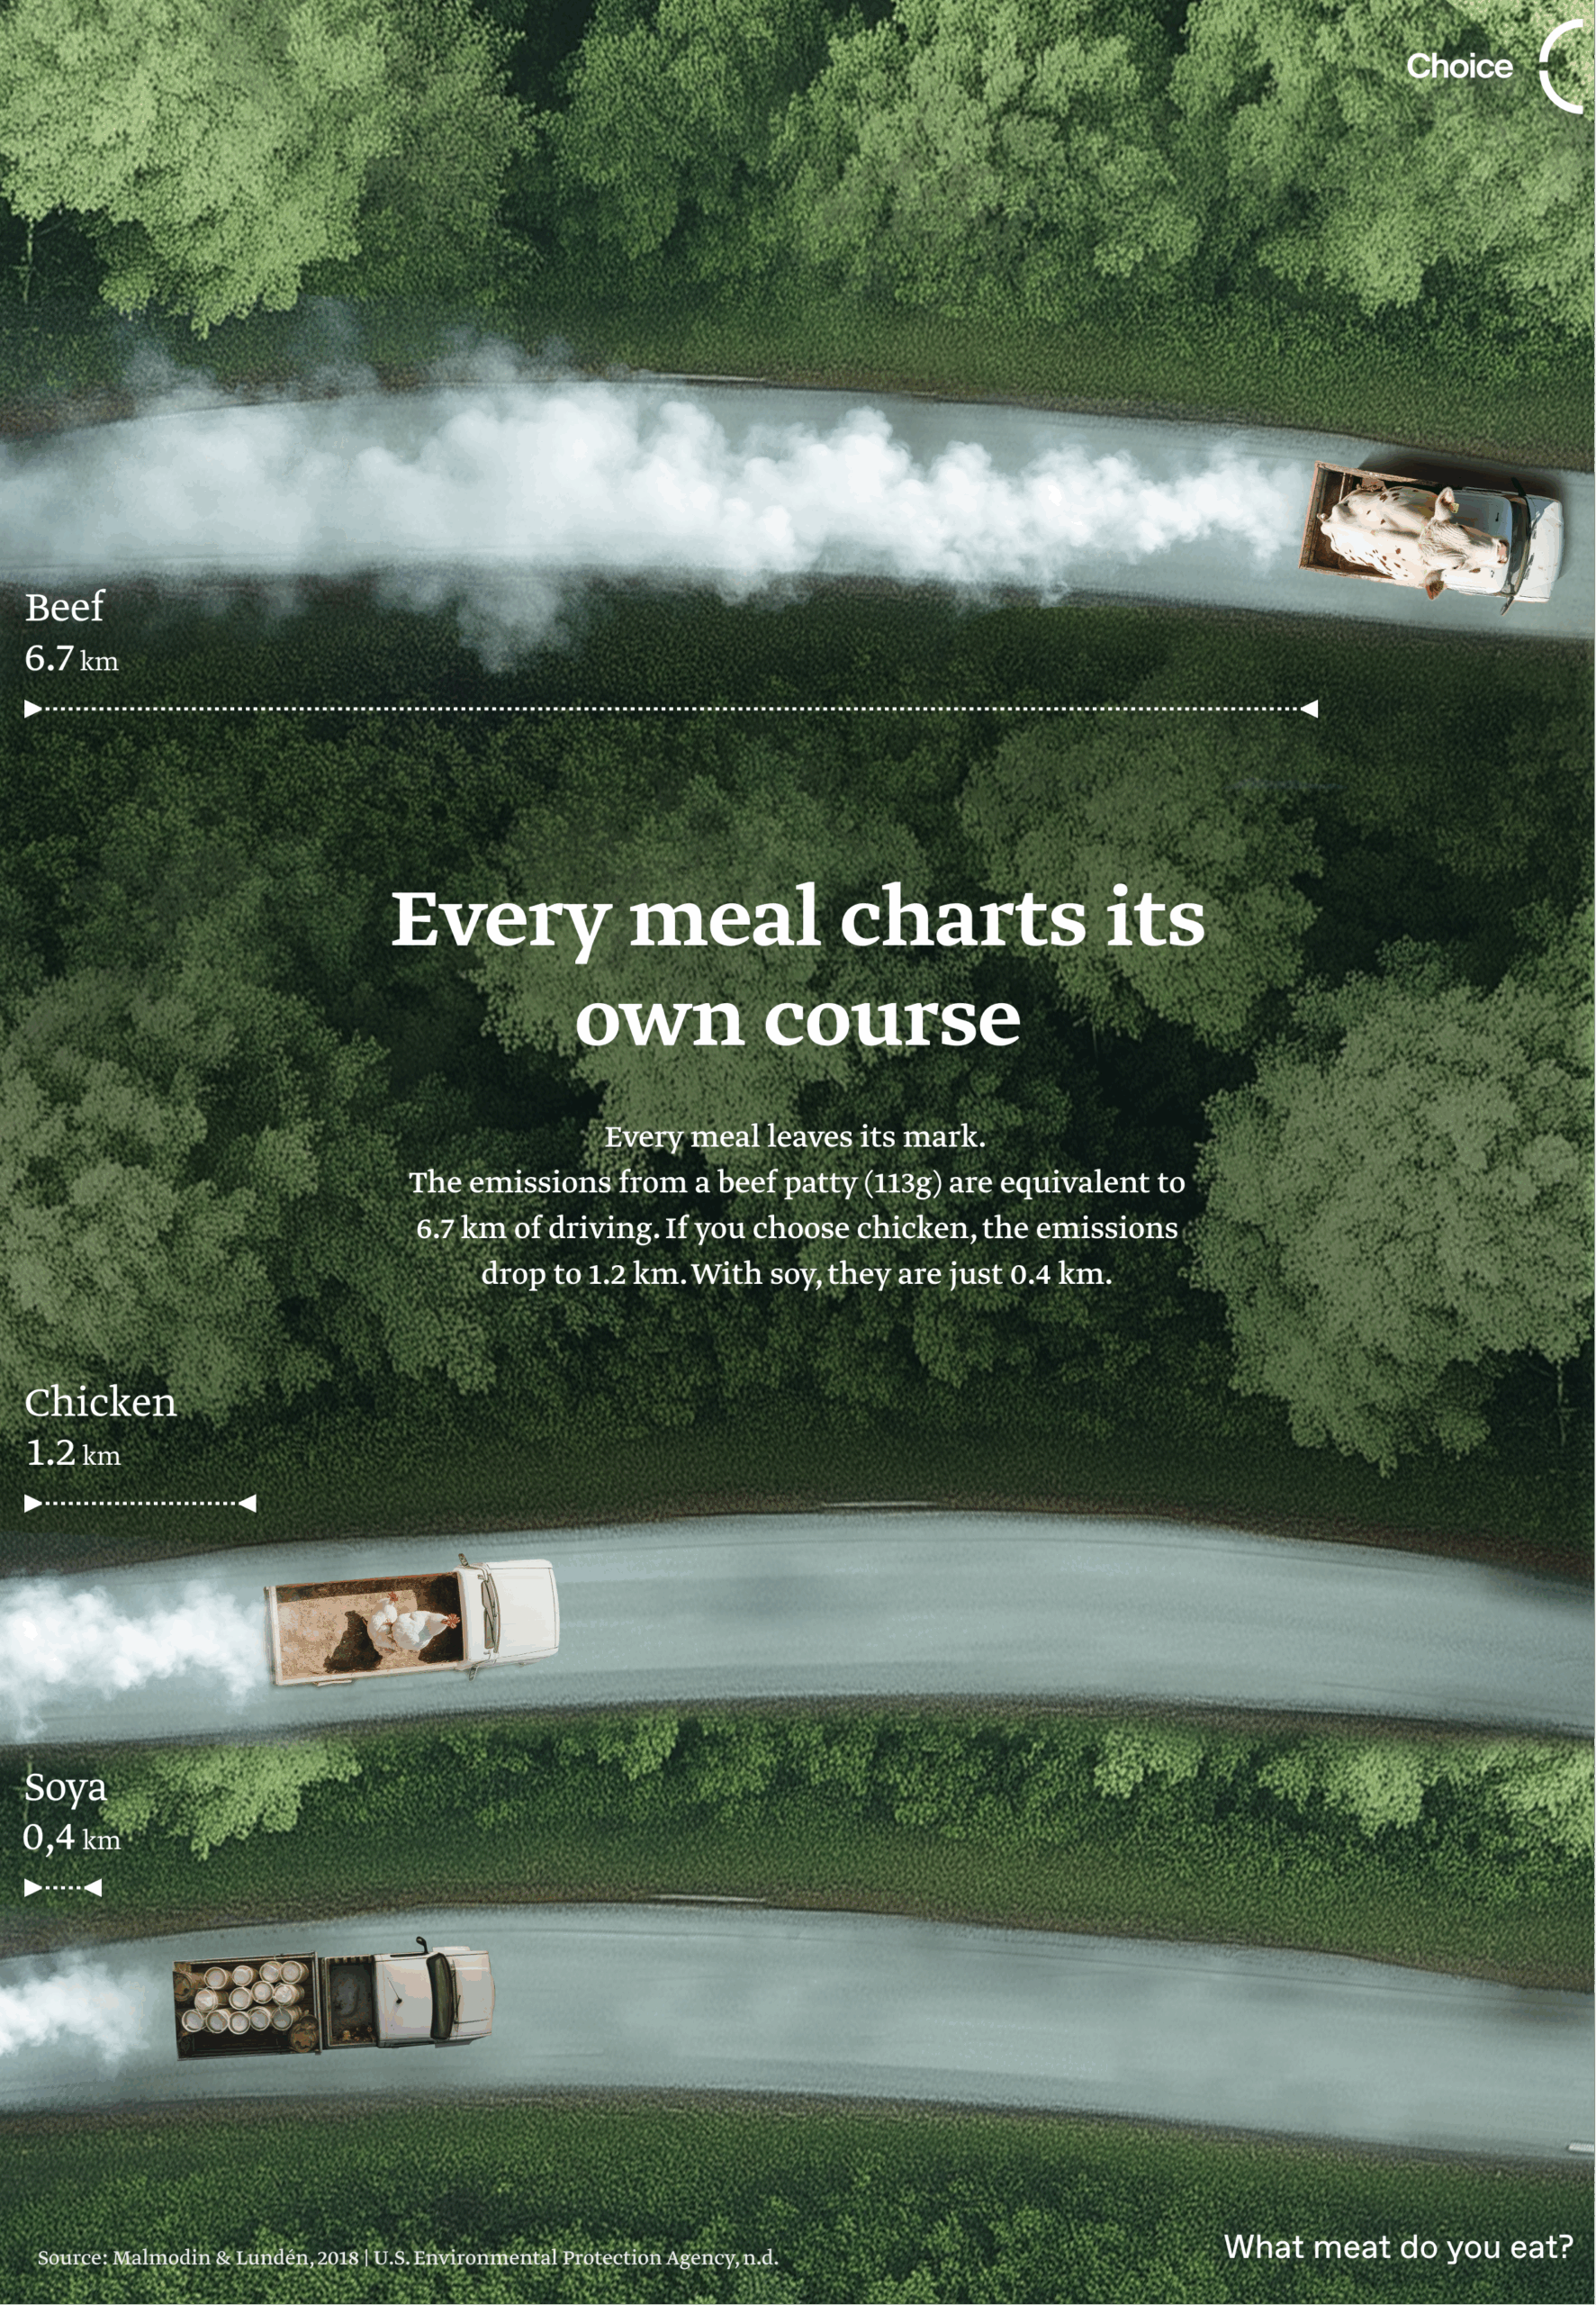
“Every meal charts its own course” Tap on the picture to read the full story!
Source:
- Malmodin, J., & Lundén, D. (2018).The Energy and Carbon Footprint of the Global ICT and E&M Sectors 2010–2015. Sustainability, 10(9), 3027.
- U.S. Environmental Protection Agency (n.d.). Greenhouse gas equivalencies calculator. Retrieved on November 15, 2024, from Greenhouse Gas Equivalencies Calculator | US EPA
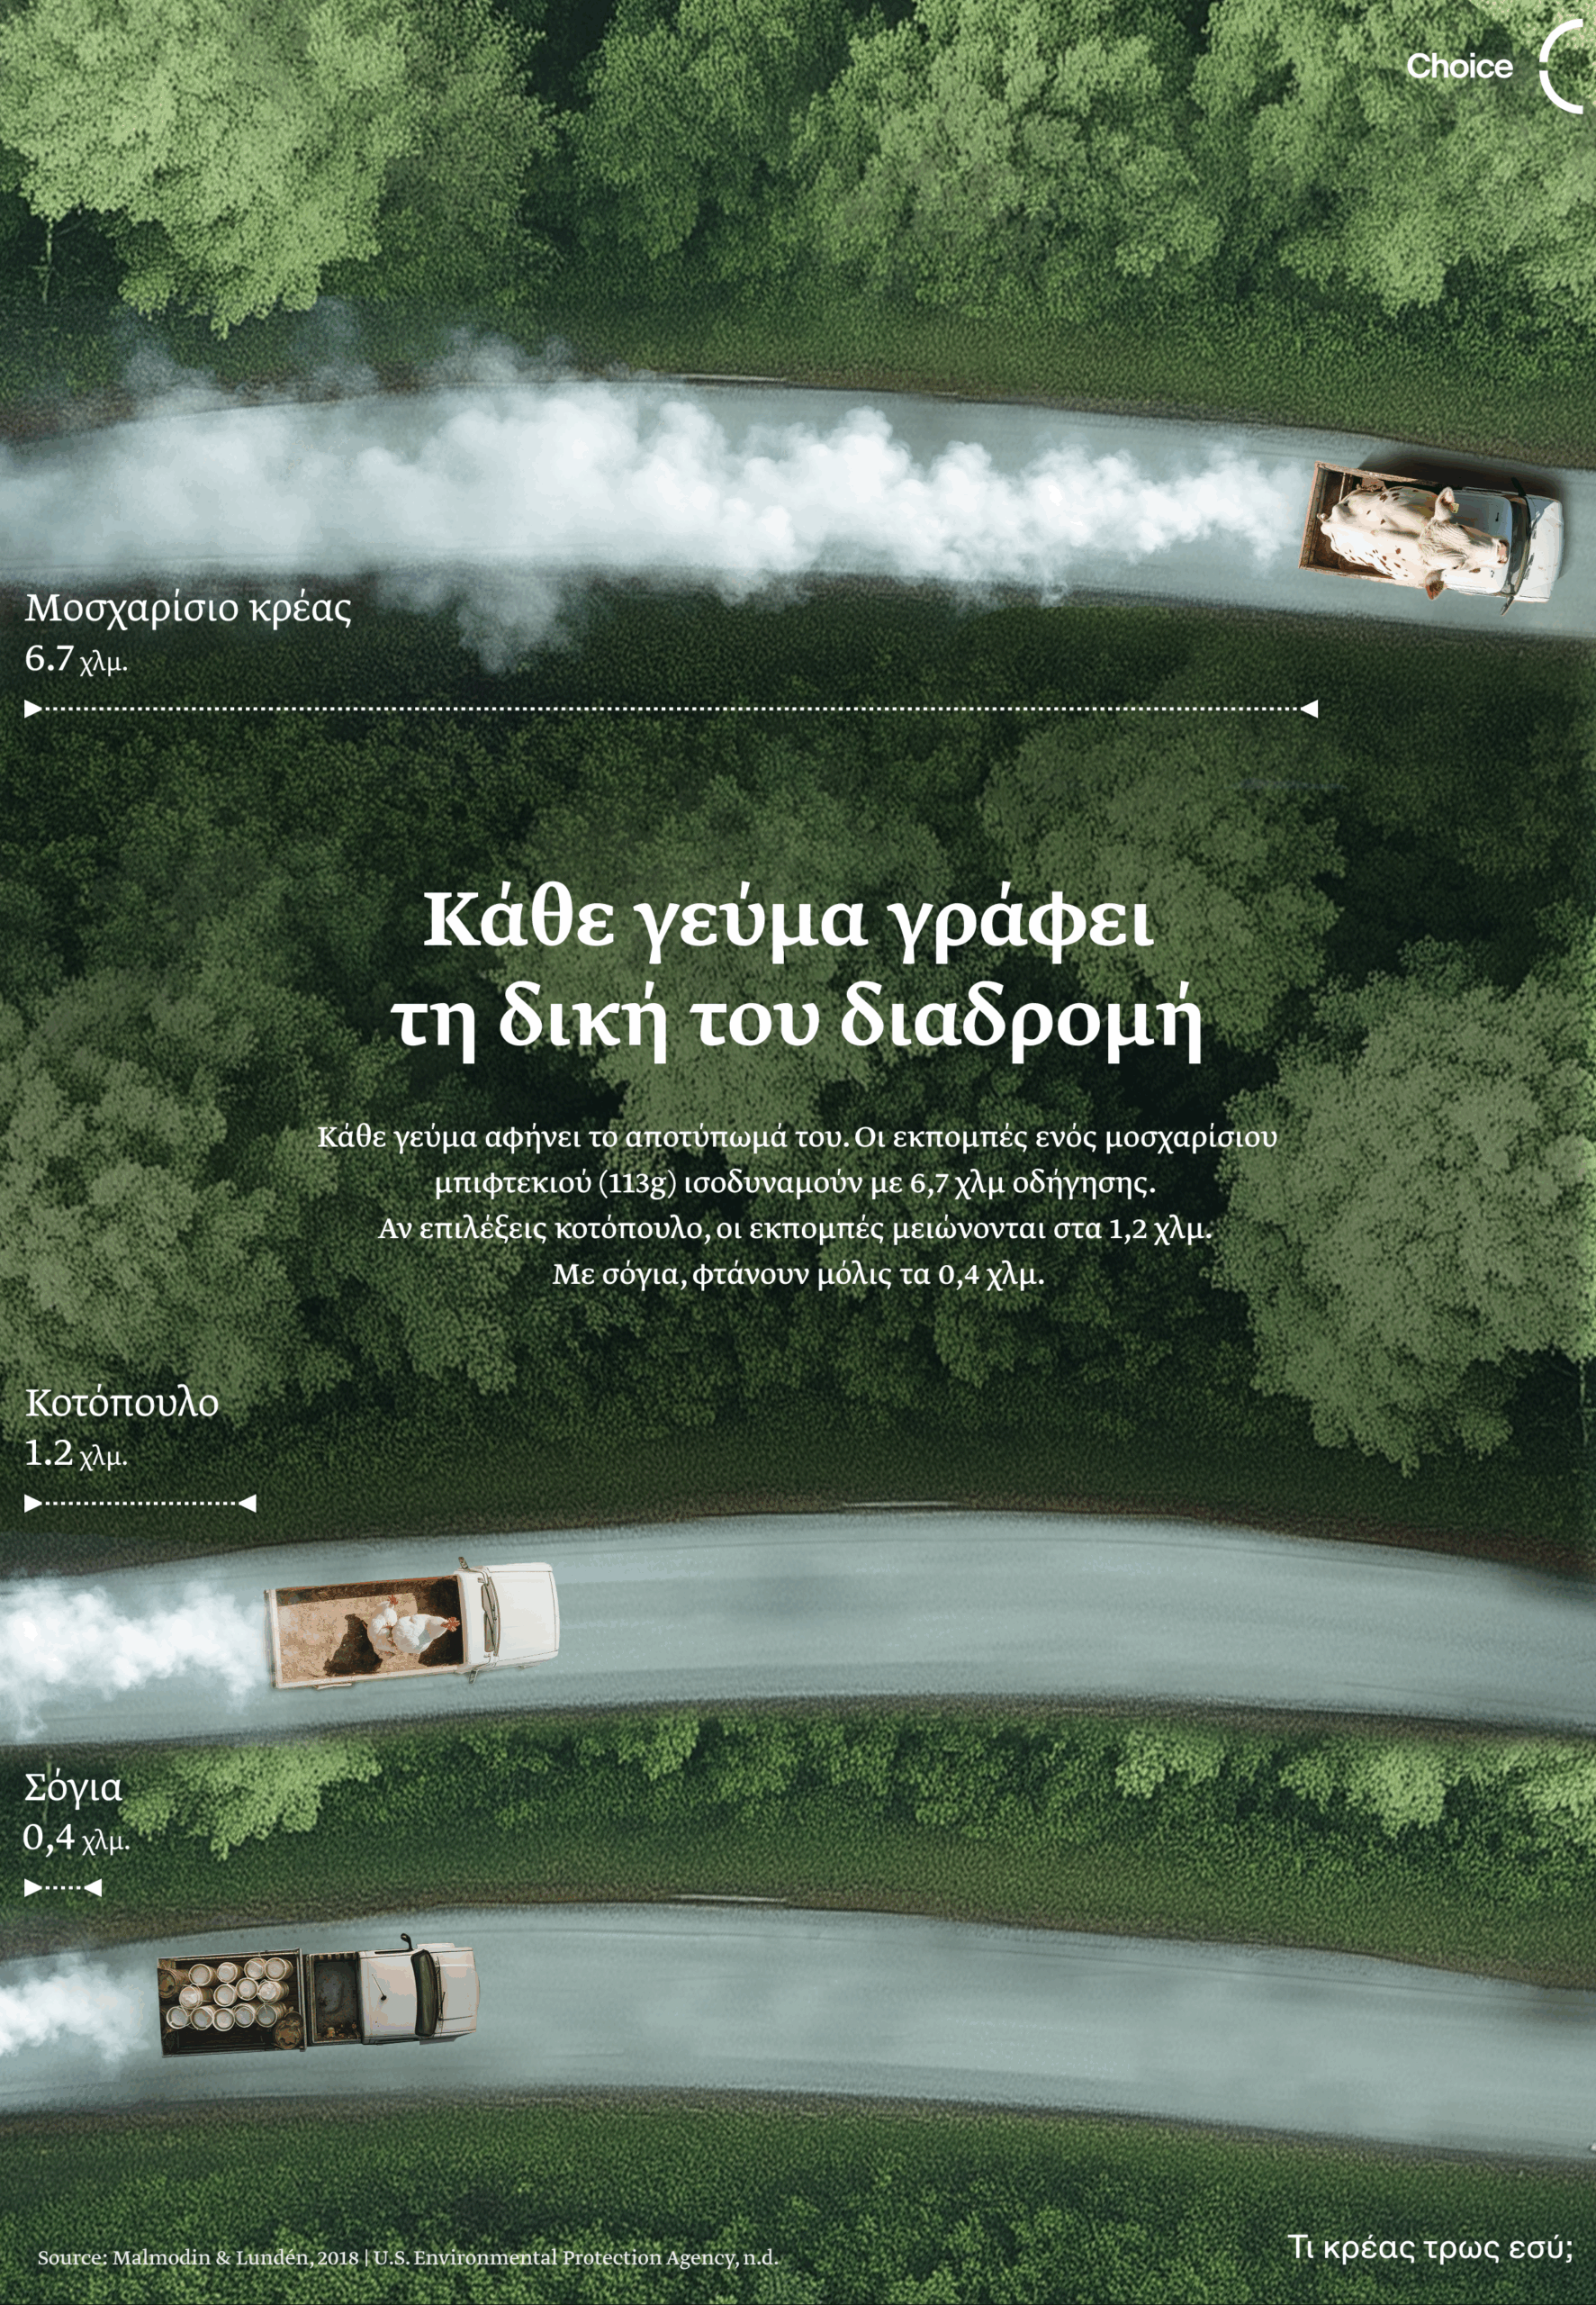
“Every meal charts its own course” (GR) Tap on the picture to read the full story!
Source:
- Malmodin, J., & Lundén, D. (2018).The Energy and Carbon Footprint of the Global ICT and E&M Sectors 2010–2015. Sustainability, 10(9), 3027.
- U.S. Environmental Protection Agency (n.d.). Greenhouse gas equivalencies calculator. Retrieved on November 15, 2024, from Greenhouse Gas Equivalencies Calculator | US EPA